Analytics
Monitor your streaming usage through the Analytics section in the Control Panel.
Prerequisites
Access to the Control Panel.
Instructions
Step 1. Accessing the Analytics dashboard
Use your log in credentials to sign in to the Control Panel.
In the left side panel of the Control Panel interface, click on the Analytics tab.


Image 1. Analytics dashboard
Step 2. Filtering data by Date range
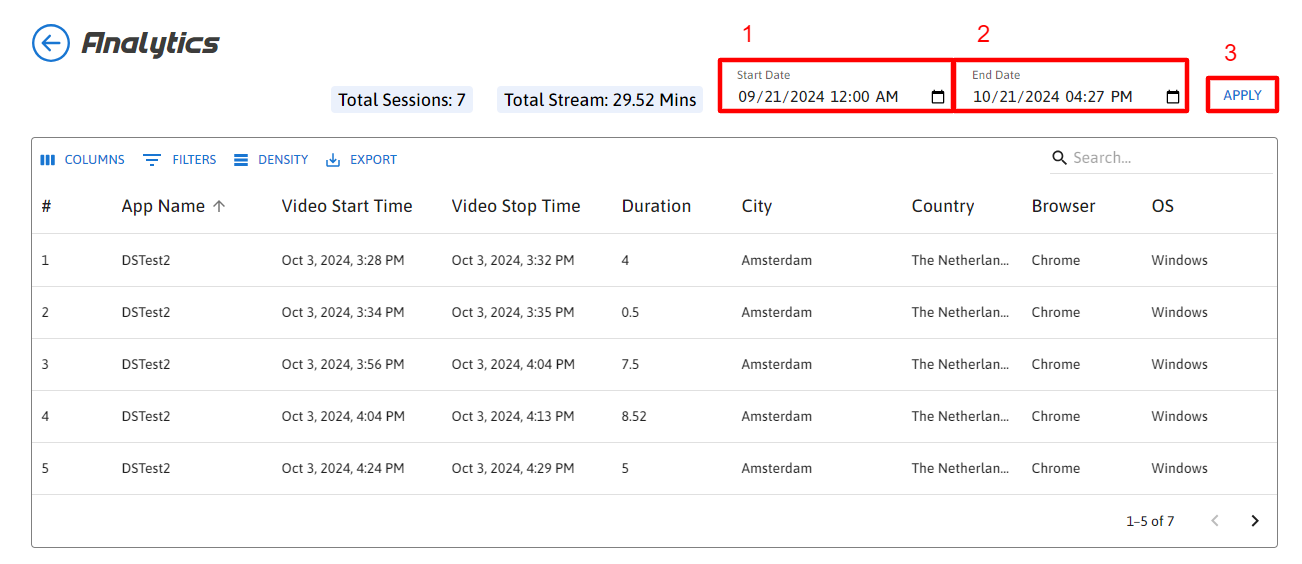
Navigate to the upper right corner of the dashboard.
Use the Start Date and End Date fields to select the time range for the data you want to view.
Click Apply to update the dashboard with data from the selected period.

Image 2. Filter Data by Date
Step 3. Viewing and understanding the Session Table
The session table displays detailed information for each streaming session. Key data points include:
App Name: The name of the application streamed.
Video Start Time: The time the session started.
Video Stop Time: The time the session ended.
Duration: The total length of the streaming session (in minutes).
City: The city where the session originated.
Country: The country of the user.
Browser: The web browser used by the user.
OS: The operating system used.

Image 3. Key data points
Step 4. Using Filters and Columns
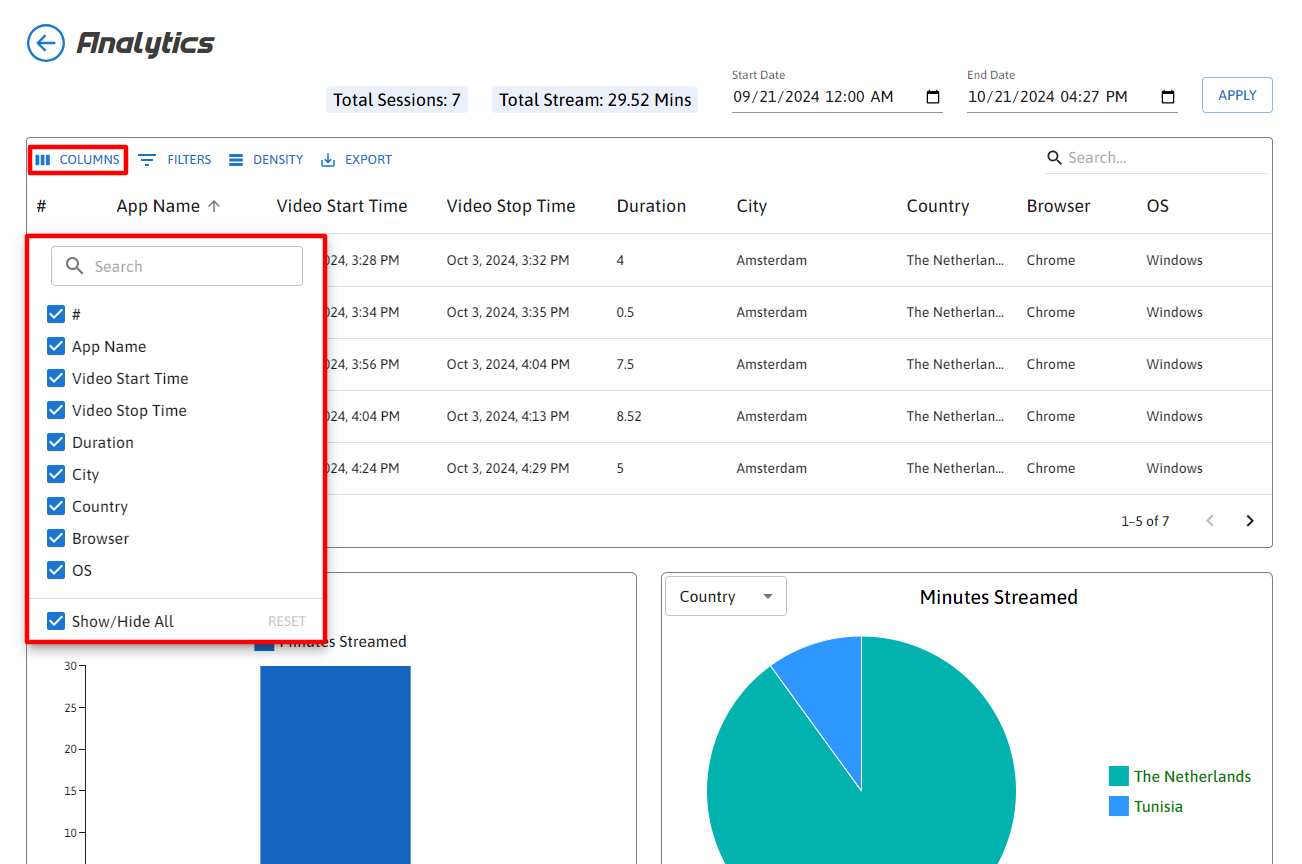
To customize the table view, click Columns to show or hide data fields.

Image 4. Columns
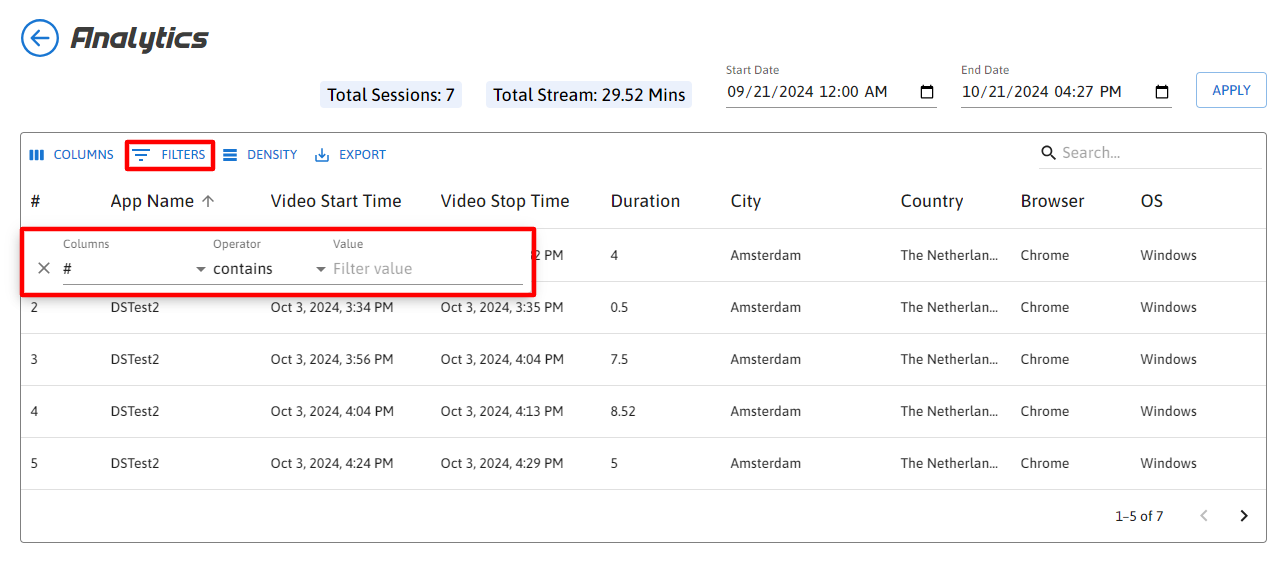
Use Filters to narrow down session data by specific criteria, such as country, browser, or app name.

Image 5. Filters
Use the Search bar to find specific sessions based on keywords.
Step 5. Exporting Session Data
To download session information, click Export at the top of the session table.
Click Download as CSV to download the session data for further analysis.
Click Print for a copy of the session data.

Image 6. Export Session Data
Step 6. Graphical Data insights
Below the session table, you will find two charts to help visualize the data:
Minutes Streamed by App: This bar chart displays the total minutes streamed for each application.
Expand the dropdown menu to select other data points, such as City, Browser, or OS.
Minutes Streamed by Country: This pie chart shows the total minutes streamed per country.
Use the dropdown menu to switch to other categories like City, Browser, or OS.

Image 7. Graphical Data insights
Need help?
If you need any assistance, feel free to reach out through any of the following channels:
🛠️ Support Portal: Contact Our Support Team
💬 Discord Community (Faster Support): Join Our Discord Community
📧 Email Support: support@eagle3dstreaming.com
Follow us on:
Facebook | GitHub | LinkedIn | YouTube
