Debugging and Testing Pixel Streaming Code
This guide explains how to use breakpoints to debug Blueprint logic inside a remote Unreal Editor session running with Pixel Streaming.
Video Preview
https://youtu.be/6VwY0OrQ9Ek(Check timestamp: 2:39–3:25)
Debugging with a Breakpoint
If your Blueprint logic is not executing as expected, you can use the Blueprint Debugger to trace execution flow directly on the server.
Follow the steps below:
In the remote editor session streaming in your browser, open the Level Blueprint (or the Blueprint you wish to debug).
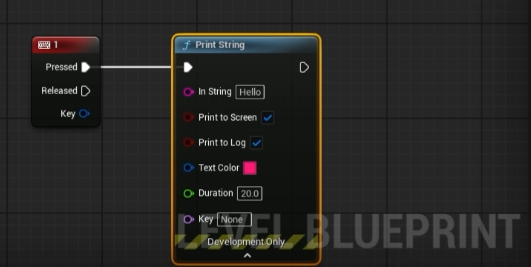
Locate the node where you suspect the issue might be. For this example, we'll use the Print String node.

Figure 1. Locate the Node
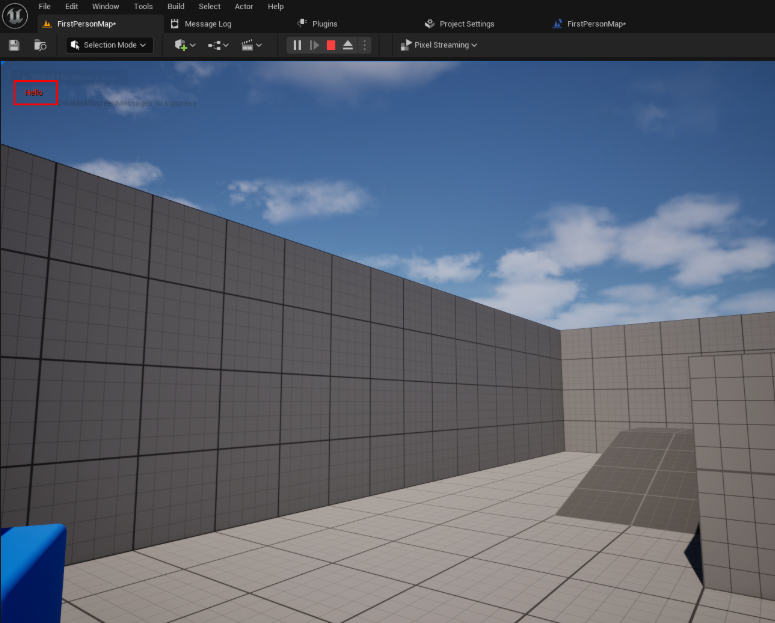
If you press 1 it’ll print “Hello” on the screen

Figure 2. Press 1
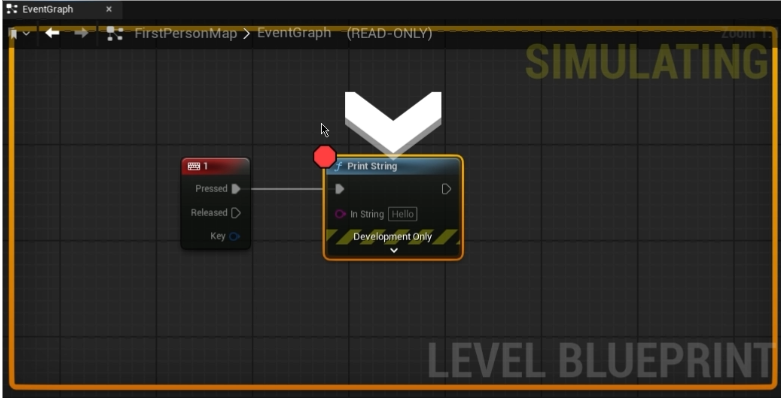
Right-click on the Print String node and select Add Breakpoint from the context menu. A solid red octagon icon will appear on the node, indicating that the breakpoint is active.
Return to the main editor viewport and trigger the event. In this case, press the 1 key.
Expected Result: The remote editor session will pause, and the view will automatically switch to the Blueprint's Event Graph. A large red arrow will point to the node with the breakpoint, showing that the program's execution has paused at that exact point.

Figure 3. Remote Editor Session Paused
This confirms that the keypress is being detected and the Blueprint logic is running up to that point. You can now hover your mouse over the node's input and output pins to inspect the data values at that moment in time, helping you identify the source of the problem.
Related Guides
Need help?
If you need any assistance, feel free to reach out through any of the following channels:
🛠️ Support Portal: Contact Our Support Team
💬 Discord Community (Faster Support): Join Our Discord Community
📧 Email Support: support@eagle3dstreaming.com
Follow us on:
Facebook | GitHub | LinkedIn | YouTube
